Linking structural and functional connectivity in resting state macroscale neuroimaging
- Anirudh Wodeyar
- Sep 19, 2021
- 2 min read
A critical question of modern macroscale neuroimaging (fMRI/EEG/MEG) is what explains the statistical properties of the signals measured. An interesting insight made recently testable by new tools (DTI) is that the functional connectivity we measure arises from the scaffolding of the anatomical connectivity. I built a generative model that derived the functional connectivity from the structural connectome by presuming that the connectome guides non-zero values in the precision matrix for the data. Using this method, I showed how we can both circumvent the measurement difficulties of EEG(a) and MEG(b) (volume conduction) and directly infer the importance of the structural connectome to the spatial statistical properties of rhythms. Further, I demonstrated that in stroke, using our method but not the commonly used approach of correlation, connections that have been lesioned show reduced fMRI functional connectivity(c).
Wodeyar, A., & Srinivasan, R. (2018). Network Structure During Encoding Predicts Working Memory Performance. bioRxiv, [Preprint]. 409615. Available from https://www.biorxiv.org/content/10.1101/409615v2.full
Wodeyar, A., & Srinivasan, R. Contribution of structural connectivity to MEG functional connectivity. bioRxiv, 785600 [Preprint]. Available from: https://www.biorxiv.org/content/10.1101/785600v1.full
Wodeyar, A., Cassidy, J. M., Cramer, S. C., & Srinivasan, R. (2020). Damage to the structural connectome reflected in resting-state fMRI functional connectivity. Network Neuroscience, 4(4), 1197-1218.
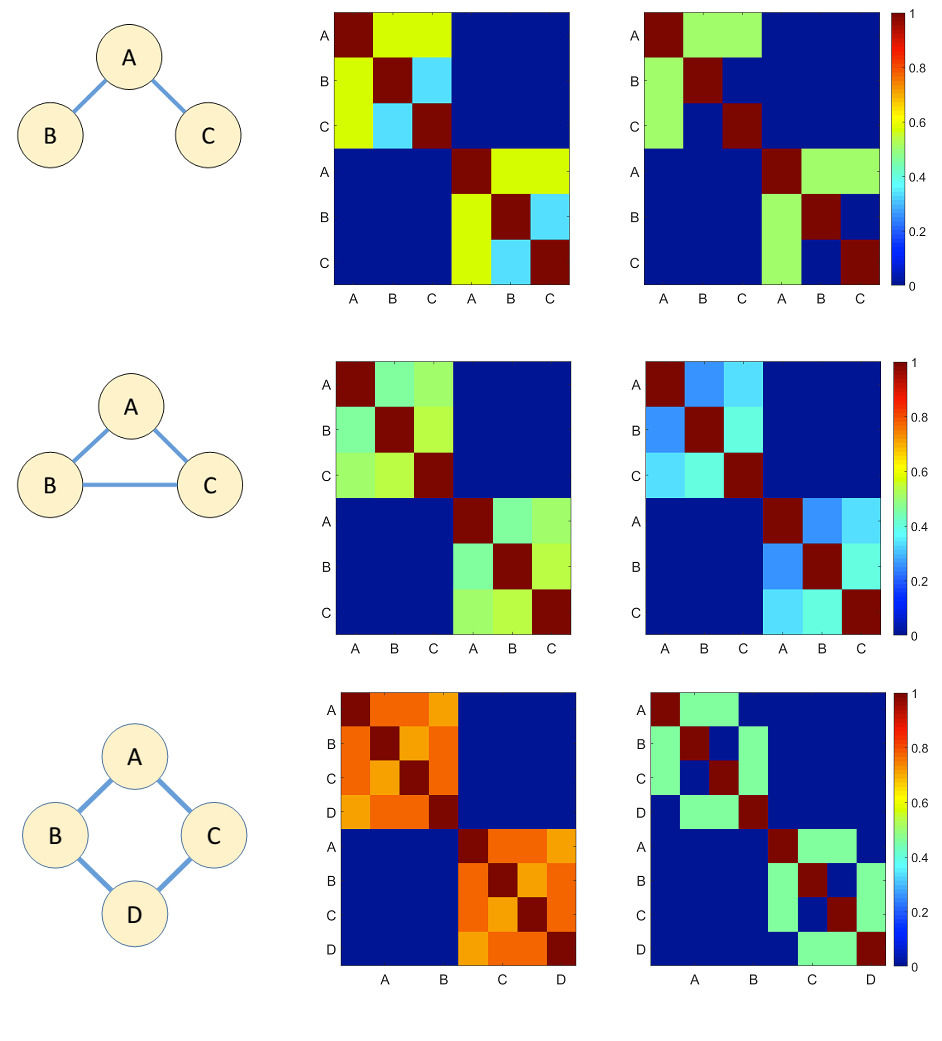
An important issue that was solved by our approach is the common input problem, depicted in the image above. The common input problem asks whether a relationship between two sources is driven by the presence of a third source.We represent these sources here by A, B and C and we see in the top figure that when there is a relationship between A with B and C, the covariance is unable to distinguish this difference from B being connected to C whereas the precision does in fact make this difference visible.In the second from top figure we see that when there is in fact a relationship between B and C this is well reflected in both covariance and precision.In the bottom set of figures we show how multiple sources
of common inputs can be detected if using the precision.

Comments